What Are Monitors?
Monitors are automated checks that continuously test the availability and performance of your websites, APIs, and services. StatusPage.one monitors run checks every minute to ensure your services are operational.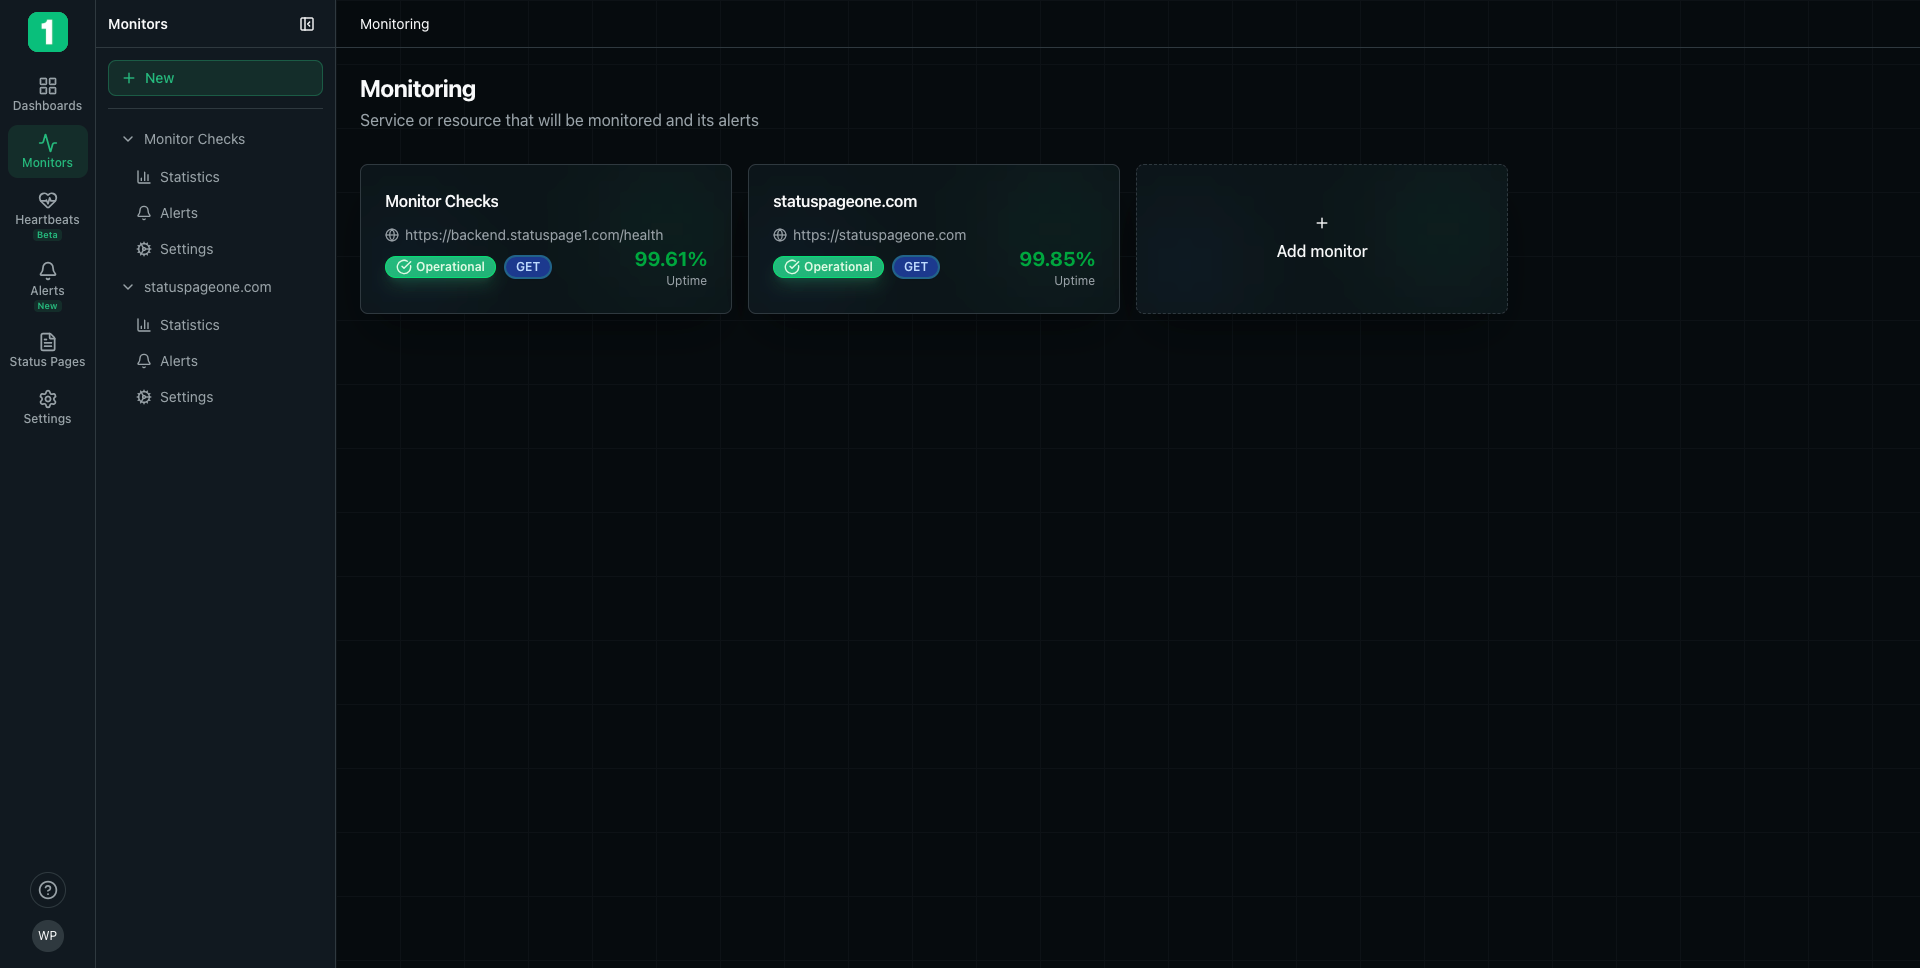
Monitor Cards
Each monitor is displayed as a card showing key information at a glance:Monitor Information
- Monitor Name - The friendly name you gave your monitor (e.g., “Monitor Checks”, “statuspageone.com”)
- URL - The endpoint being monitored
- Status Badge - Current operational status
- Operational (Green) - Monitor is up and responding normally
- Degraded (Yellow) - Monitor is experiencing issues
- Down (Red) - Monitor is not responding
- Request Method - HTTP method used for checks (GET, POST, etc.)
- Uptime Percentage - Overall uptime over the selected time period
Monitor Sections
Each monitor in the sidebar provides access to three main sections:- Statistics - View detailed performance metrics and uptime trends
- Alerts - Configure alert rules for this specific monitor
- Settings - Adjust monitor configuration and advanced options
Monitor Organization
Monitors are organized in the left sidebar for easy navigation:- Click on a monitor name to expand its options
- Select Statistics, Alerts, or Settings to view that section
- Use the New button at the top to create additional monitors
Adding Monitors
To add a new monitor, click the Add monitor button or the + New button in the sidebar. This will open the monitor creation form where you can configure your new uptime check.Create Your First Monitor
Learn how to set up a new monitor
Monitor Status Indicators
Operational Status
The status badge shows the real-time operational state of your monitor:- Green (Operational) - All checks are passing, service is healthy
- Yellow (Degraded) - Some checks are failing or performance is degraded
- Red (Down) - Monitor is consistently failing checks
Uptime Percentage
The uptime percentage is calculated based on successful checks over the selected time period. For example:- 99.85% indicates excellent uptime with minimal downtime
- 99.61% shows very good uptime with occasional issues
Uptime percentages are updated in real-time as checks complete. Higher percentages indicate better reliability.
Managing Multiple Monitors
You can create unlimited monitors to track all your critical services:- Websites - Monitor your main website and landing pages
- APIs - Track API endpoints and health check routes
- Services - Monitor microservices and backend systems
- Third-party Services - Keep tabs on external dependencies
Best Practices
Group Related Monitors
Group Related Monitors
Use Descriptive Names
Use Descriptive Names
Give monitors clear names that identify what they’re checking. “Production API Health” is better than “API Monitor 1”.
Monitor Critical Paths
Monitor Critical Paths
Focus on monitoring the most important user-facing endpoints and services first.
Set Appropriate Check Intervals
Set Appropriate Check Intervals
Balance monitoring frequency with your needs. Critical services might need checks every minute, while less critical ones could use longer intervals.
Quick Actions
From the monitors list, you can:- View Statistics - Click on a monitor’s Statistics section to see detailed performance data
- Configure Alerts - Set up notifications for when monitors go down
- Adjust Settings - Modify check frequency, timeout values, and other parameters
- Add Monitors - Quickly create new monitors to expand coverage
Next Steps
Create a Monitor
Set up your first uptime monitor
View Statistics
Analyze performance and uptime data
Configure Alerts
Get notified when issues occur
Build a Status Page
Share monitor status with your users