Creating a New Monitor
To create a new monitor, click the + New button in the Monitors sidebar or click Add monitor from the monitors list.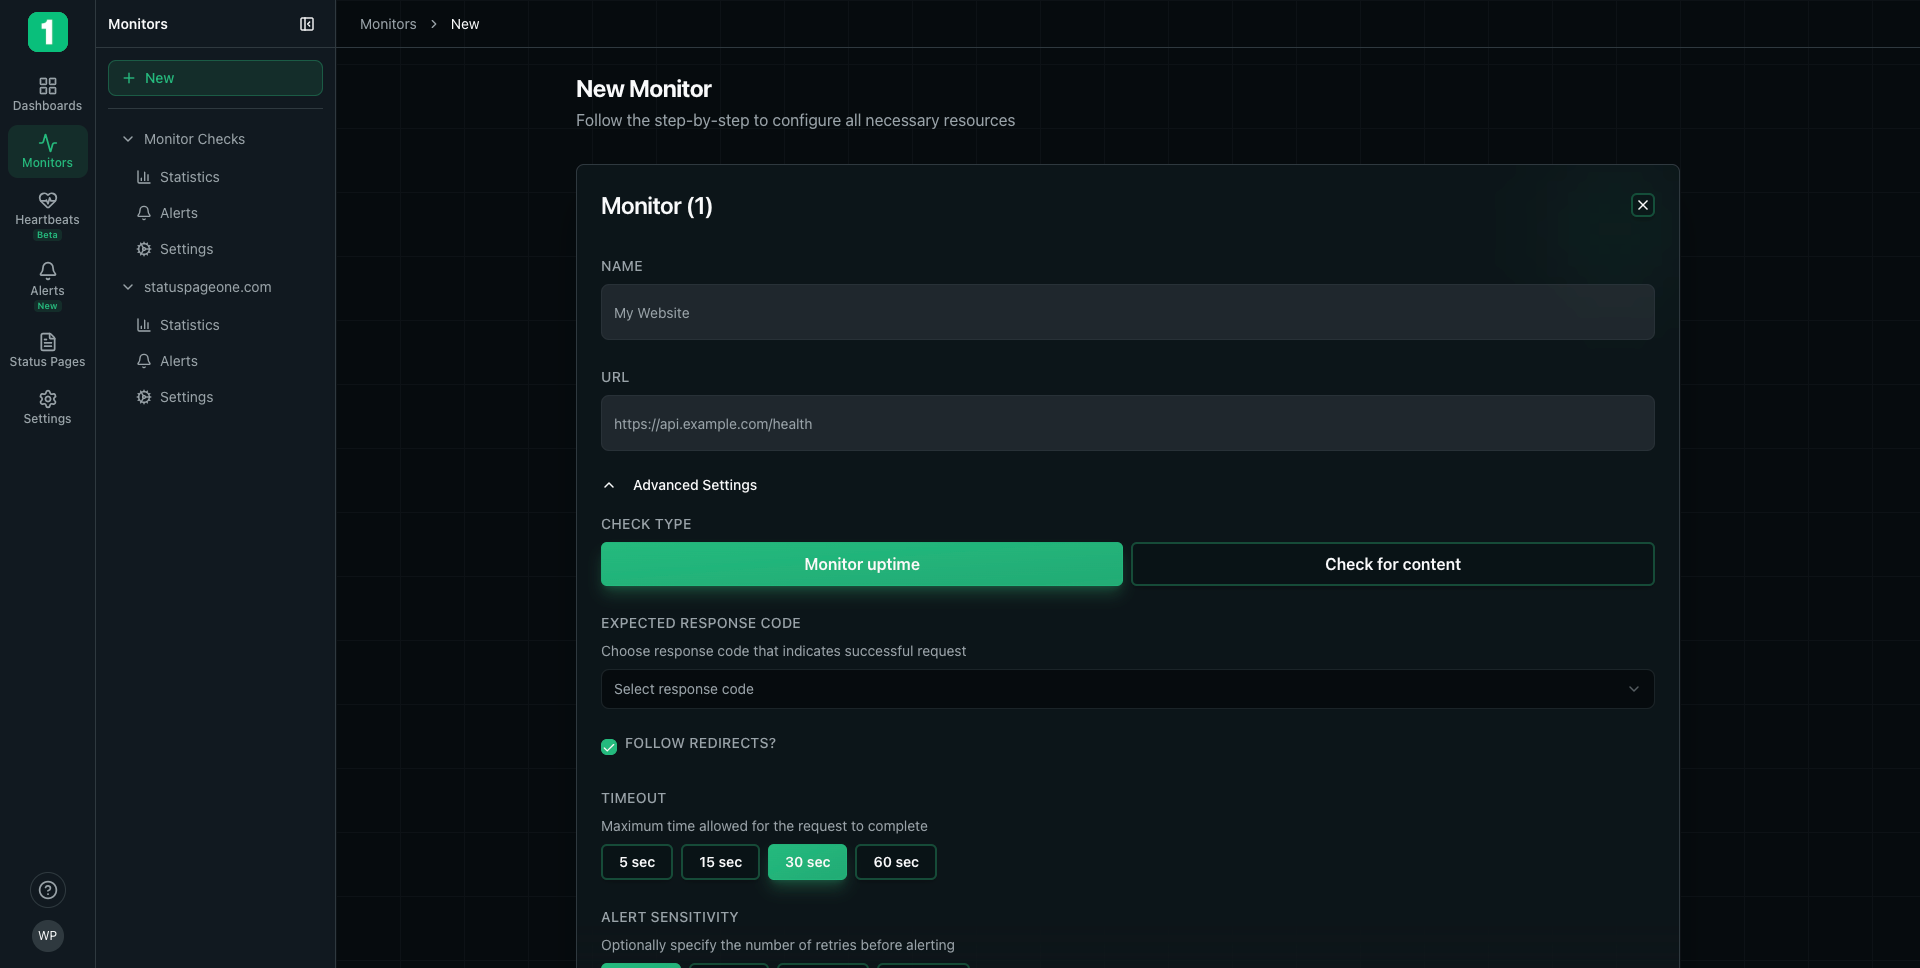
Basic Configuration
Monitor Name
Give your monitor a descriptive name that identifies what you’re monitoring. Examples:- “Production API”
- “Marketing Website”
- “Payment Gateway”
- “Customer Portal”
URL
Enter the full URL you want to monitor, including the protocol (http:// or https://). Examples:https://api.example.com/healthhttps://www.example.comhttps://app.example.com/status
Advanced Settings
Click Advanced Settings to access additional configuration options.Check Type
Choose how you want to monitor your endpoint:- Monitor Uptime
- Check for Content
Checks if your endpoint is accessible and responding. This is the most common monitor type.Best for:
- Websites
- API health checks
- Service availability monitoring
Expected Response Code
Select the HTTP status code that indicates a successful request. Common Options:- 200: OK - Standard successful response (default)
- 201: Created - For POST requests that create resources
- 204: No Content - For successful requests with no response body
- Other codes - Select from dropdown for specific requirements
Most monitors should use 200 (OK). Only change this if your endpoint intentionally returns a different success code.
Follow Redirects
Enable this option to have monitors follow HTTP redirects (301, 302, etc.). When to enable:- ✓ Your URL redirects to another page (e.g., http → https)
- ✓ You want to check the final destination after redirects
- ✗ You want to verify the redirect itself works correctly
- ✗ You’re testing redirect behavior
Timeout
Set the maximum time to wait for a response before considering the check failed. Available Options:- 5 seconds - For fast, local services
- 15 seconds - For most web applications
- 30 seconds - Standard timeout (recommended)
- 60 seconds - For slower endpoints or complex operations
Alert Sensitivity
Configure how many consecutive failures must occur before triggering an alert. Purpose:- Reduces false alarms from temporary network issues
- Ensures alerts only fire for sustained problems
- Balances early warning with accuracy
- 1-2 retries - Critical services requiring immediate notification
- 3-4 retries - Most production services (balanced approach)
- 5+ retries - Services with occasional expected timeouts
Editing Monitor Settings
You can modify monitor configuration at any time from the monitor’s Settings page.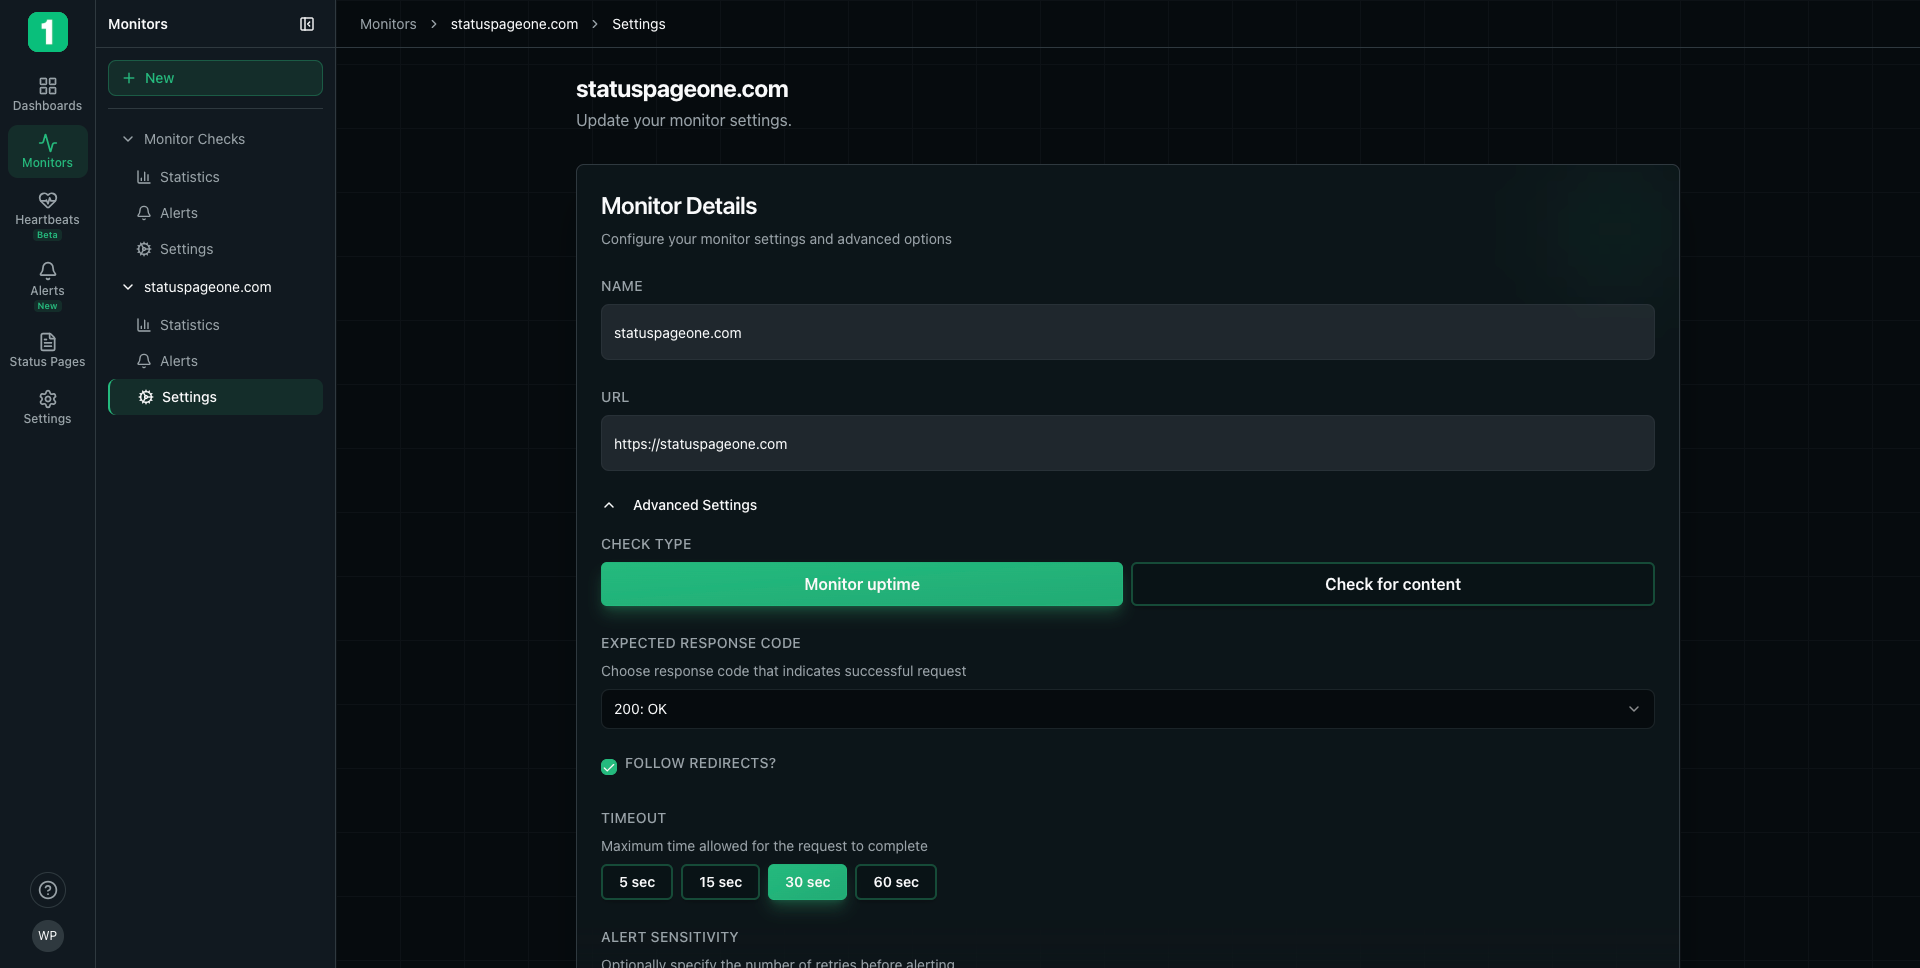
Updating Configuration
- Navigate to your monitor in the sidebar
- Click Settings
- Modify any configuration options
- Changes are saved automatically
Configuration Examples
Example 1: Simple Website Monitor
Example 2: API Health Check
Example 3: Content Verification
Best Practices
Monitor Health Check Endpoints
Monitor Health Check Endpoints
Instead of monitoring your homepage, create dedicated
/health or /status endpoints that verify your application is functioning correctly.Use HTTPS When Possible
Use HTTPS When Possible
Always use
https:// URLs when your service supports it to ensure secure monitoring.Set Realistic Timeouts
Set Realistic Timeouts
Configure timeouts based on your actual response times. Check your statistics to see typical response times, then set timeouts 2-3x higher.
Balance Alert Sensitivity
Balance Alert Sensitivity
Too few retries creates false alarms. Too many delays real alerts. Start with 3-4 retries for most services.
Test Your Configuration
Test Your Configuration
After creating a monitor, wait a few minutes and check the Statistics page to verify it’s working correctly.
What Happens After Creation
Once you create a monitor:- Immediate checks begin - Your monitor starts checking every minute
- Data collection starts - Statistics and uptime data begin accumulating
- Alerts activate - Configured alert rules begin monitoring for failures
- Status page updates - If linked to a status page, the component reflects monitor status
View Monitor Statistics
Learn how to analyze your monitor’s performance data
Troubleshooting
Monitor shows as Down immediately
Monitor shows as Down immediately
Possible causes:
- URL is incorrect or inaccessible
- Expected response code doesn’t match actual response
- Timeout is too short
- Redirects are disabled but URL redirects
Getting too many false alerts
Getting too many false alerts
Solution: Increase alert sensitivity (more retries) to reduce false positives from transient issues.
Response time seems incorrect
Response time seems incorrect
Note: Response time includes DNS lookup, connection time, and data transfer. This is the total time your users experience.
Next Steps
View Statistics
Analyze performance and uptime metrics
Configure Alerts
Set up notifications for downtime
Add to Status Page
Display monitor status publicly
Monitor Overview
Back to monitors overview