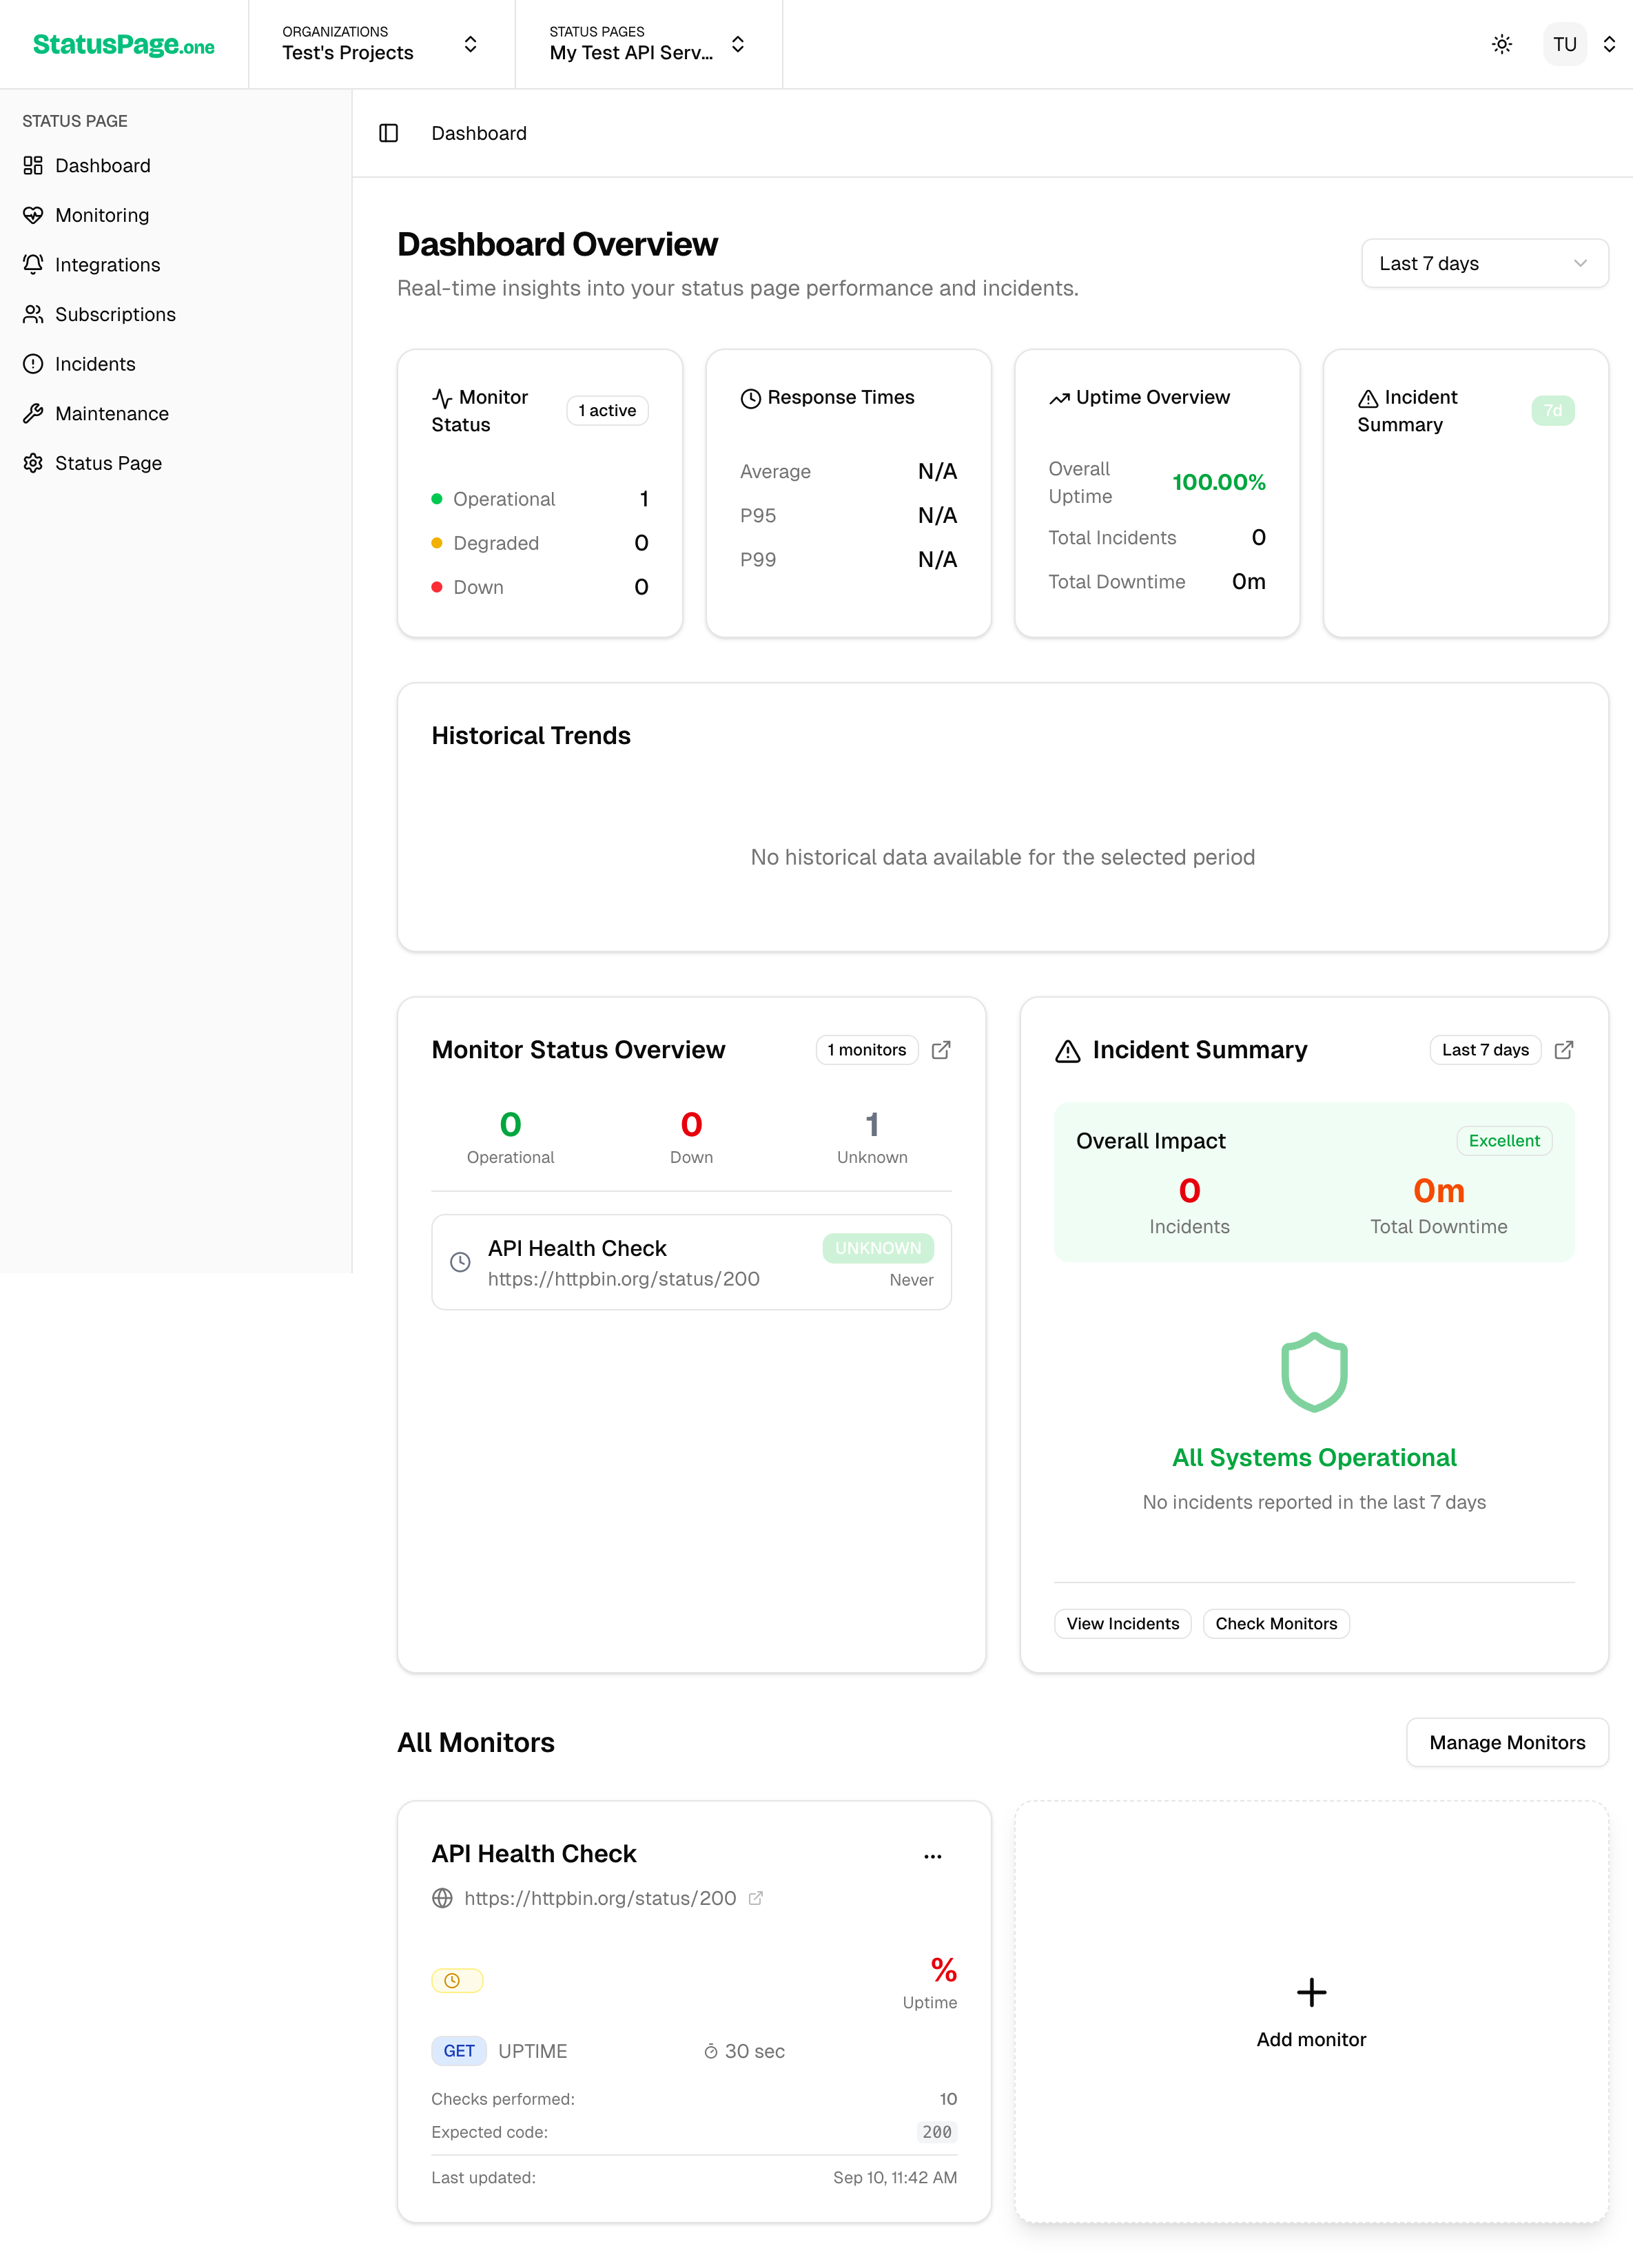
Monitoring Overview
Learn about StatusPageOne's HTTP monitoring capabilities and how to keep your services running smoothly
Monitoring Overview
StatusPageOne's monitoring system continuously watches your websites, web applications, and APIs using HTTP/HTTPS requests to detect issues before they impact your users. Our monitoring infrastructure runs from multiple regions to ensure reliable uptime monitoring.

How Monitoring Works
Our monitoring system operates on a proven HTTP-based approach:
- Scheduled HTTP Checks: We send HTTP requests to your endpoints at configured intervals
- Multi-Region Validation: Checks run from multiple regions to prevent false positives
- Instant Notifications: When issues are confirmed across regions, you're notified immediately
- Automatic Recovery Detection: We monitor for service recovery and notify you when services are back online
Our monitors currently run from two strategically located regions:
Additional regions are planned for future releases to expand global coverage.
Monitor Types
StatusPageOne specializes in HTTP/HTTPS monitoring to cover your web services and APIs:
HTTP/HTTPS Monitoring
Monitor websites, web applications, and REST APIs with comprehensive HTTP checks.
Supported HTTP Methods:
- GET (default)
- POST
- PUT
- PATCH
Features:
- Custom request headers
- Basic authentication (username/password)
- Response validation (HTTP status codes)
- Content matching (check if specific text is found or not found)
- Response time tracking
- SSL certificate validation
- Timeout configuration (5-60 seconds)
- Retry logic (0-3 retries before alerting)
Check Types:
- Uptime Monitoring: Verifies your service responds with expected HTTP status codes
- Content Monitoring: Checks if specific content is present or absent in the response
Use Cases:
- Website availability monitoring
- REST API endpoint health checks
- E-commerce site monitoring
- Authentication endpoint validation
- Health check endpoints
- Content delivery verification
Check Intervals
Monitor frequency depends on your plan:
Fixed interval for free plan monitors. Good for basic monitoring needs.
FreeFaster detection for paid plans. Ideal for production services requiring quick issue detection.
Paid PlansAlert Logic & False Positive Prevention
StatusPageOne uses intelligent alert logic to minimize false positives while ensuring you don't miss real issues.
Multi-Region Validation
When a monitor fails in one region, we automatically:
- Immediate Recheck: Retry the same region to rule out temporary network issues
- Cross-Region Check: Test from other configured regions (if you have multiple regions selected)
- Consensus Decision: Alert only when failures are confirmed across regions
- Retry Logic: Apply your configured retry attempts (0-3 retries) before alerting
Alert Sensitivity (Retry Configuration)
Configure how many retries happen before an alert is sent:
- None (0 retries): Immediate alerting on first failure
- 1 retry: Alert after 1 failed retry attempt
- 2 retries: Alert after 2 failed retry attempts
- 3 retries: Alert after 3 failed retry attempts (most conservative)
Smart Recovery Detection
We monitor for service recovery and automatically:
- Detect when services come back online
- Send recovery notifications
- Update status pages automatically
- Calculate accurate downtime duration
Response Time Monitoring
Track the performance of your services with detailed response time metrics:
Metrics We Track
- Average Response Time: Mean response time over the monitoring period
- 95th Percentile: Response time that 95% of requests fall under
- Maximum Response Time: Slowest response in the time period
- Uptime Percentage: Percentage of successful checks
Performance Alerts
Set up alerts for performance degradation:
- Slow Response Alerts: When response times exceed your threshold
- Performance Trend Alerts: When response times show degrading trends
- SLA Breach Alerts: When uptime falls below your SLA targets
Performance Monitoring Tips
- • Set response time alerts 2-3x your normal response time
- • Monitor from regions where your users are located
- • Track trends over time, not just individual slow responses
- • Consider time-of-day variations in your alert thresholds
Monitor States
Your monitors can be in one of several states:
🟢 Up (Operational)
- All recent checks have passed
- Response times are within normal ranges
- Service is fully operational
🟡 Degraded Performance
- Service is responding but slower than normal
- Some regions may be experiencing issues
- Service is partially functional
🔴 Down (Outage)
- Service is not responding or returning errors
- Multiple regions confirm the failure
- Service is unavailable
🔵 Maintenance
- Scheduled maintenance is in progress
- Monitoring may be paused or alerts suppressed
- Expected downtime period
⚪ Unknown
- Unable to determine service status
- May indicate configuration issues
- Requires investigation
Getting Started with Monitoring
Ready to set up your monitors? Here's where to go next:
- Create Your First Monitor - Step-by-step guide to setting up monitoring
- Monitor Types Deep Dive - Detailed configuration for each monitor type
- Setting Up Alerts - Configure notifications and escalation policies
- Regional Monitoring - Choose the best regions for your services
Ready to Start Monitoring?
Set up your first monitor in minutes and start getting peace of mind about your service reliability.
Create Your First Monitor
Monitoring Limits
Different plans have different monitoring capabilities:
| Feature | Starter | Professional | Enterprise |
|---|---|---|---|
| Monitors | 10 | 50 | Unlimited |
| Check Interval | 5 min | 1 min | 30 sec |
| Regions | 2 | 4 | All regions |
| Retention | 30 days | 1 year | 2 years |
| Team Members | 3 | 10 | Unlimited |
Need more monitoring capacity? Upgrade your plan or contact sales for enterprise options.
Improve this page
Found an error or want to contribute? Edit this page on GitHub.