Create a Monitor
Step-by-step guide to setting up your first monitor in StatusPageOne
Create a Monitor
Setting up monitors in StatusPageOne is straightforward. Follow this guide to create your first monitor and start monitoring your services.
Prerequisites
Before creating a monitor, you need:
- A StatusPageOne account
- At least one status page created
- The URL of the service you want to monitor
Step-by-Step Guide
1. Navigate to Monitors
- Log into your StatusPageOne console
- Select your organization
- Choose the status page where you want to add the monitor
- Click on the Monitors tab
- Click the New Monitor button
2. Basic Configuration
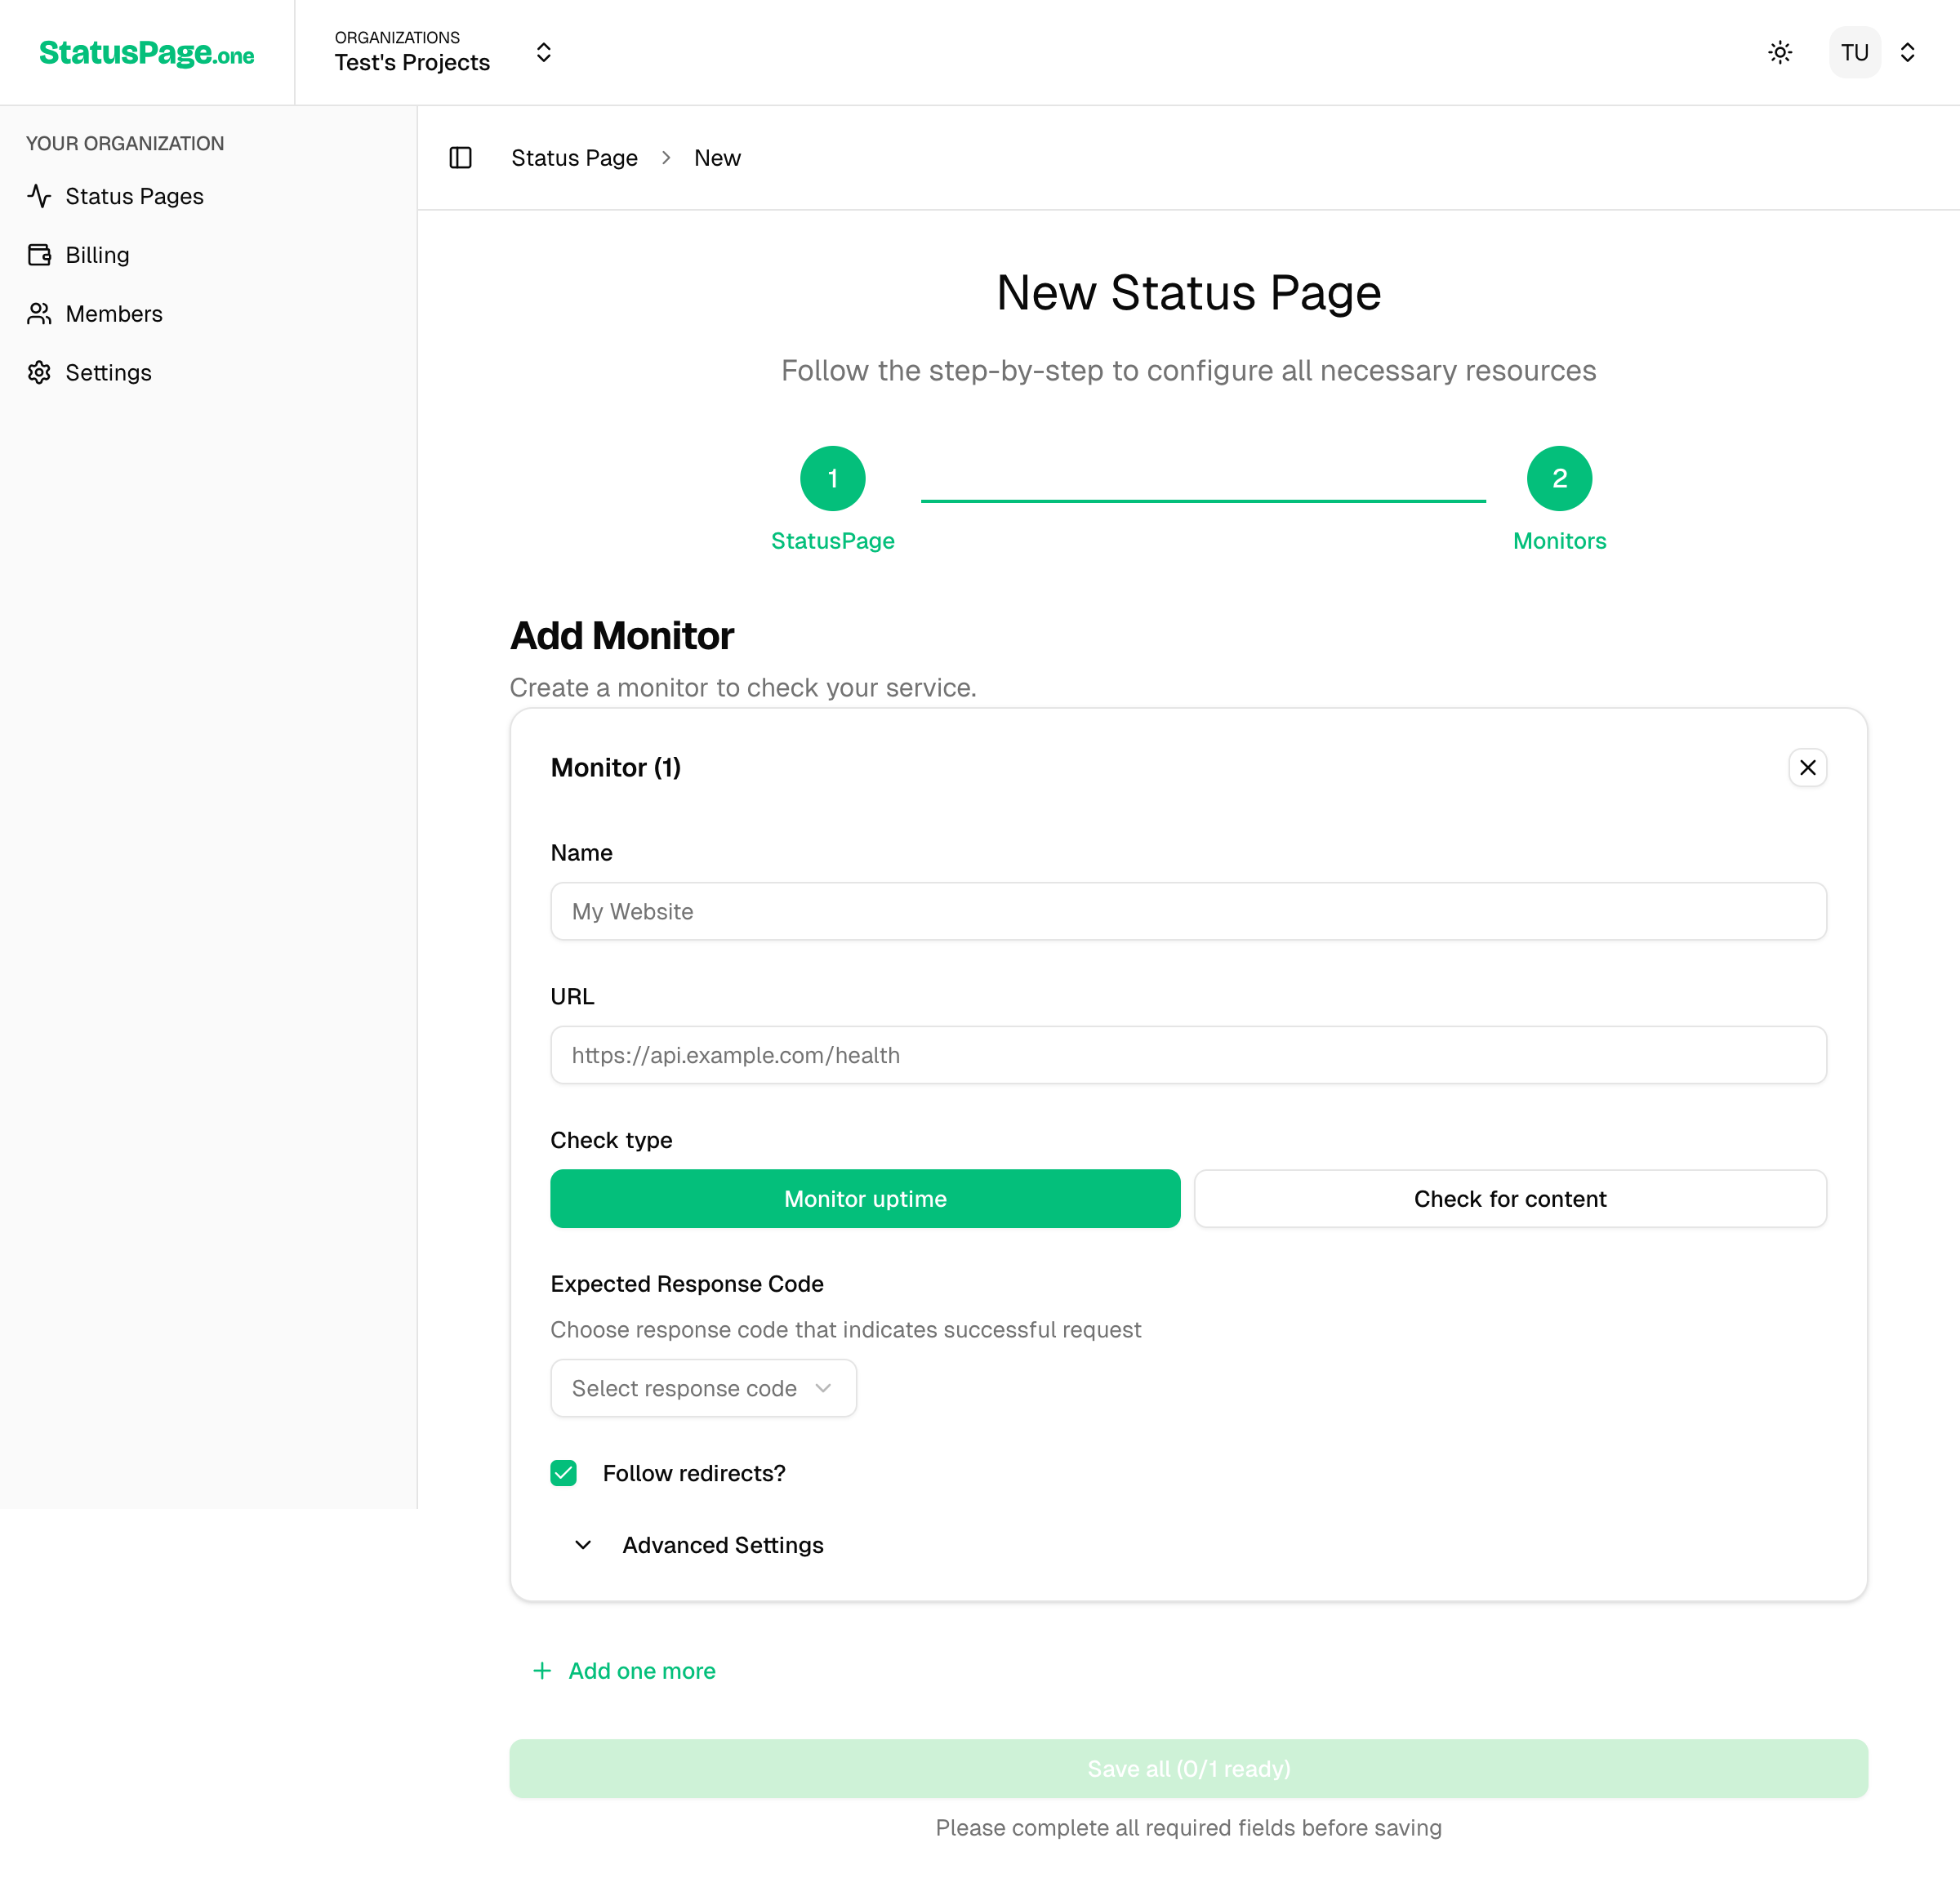
Monitor Name
Choose a descriptive name that identifies your service (e.g., "API Server", "Main Website", "Payment Gateway")
Target URL
Enter the complete URL you want to monitor. Must include protocol (https:// or http://)
https://api.example.com/health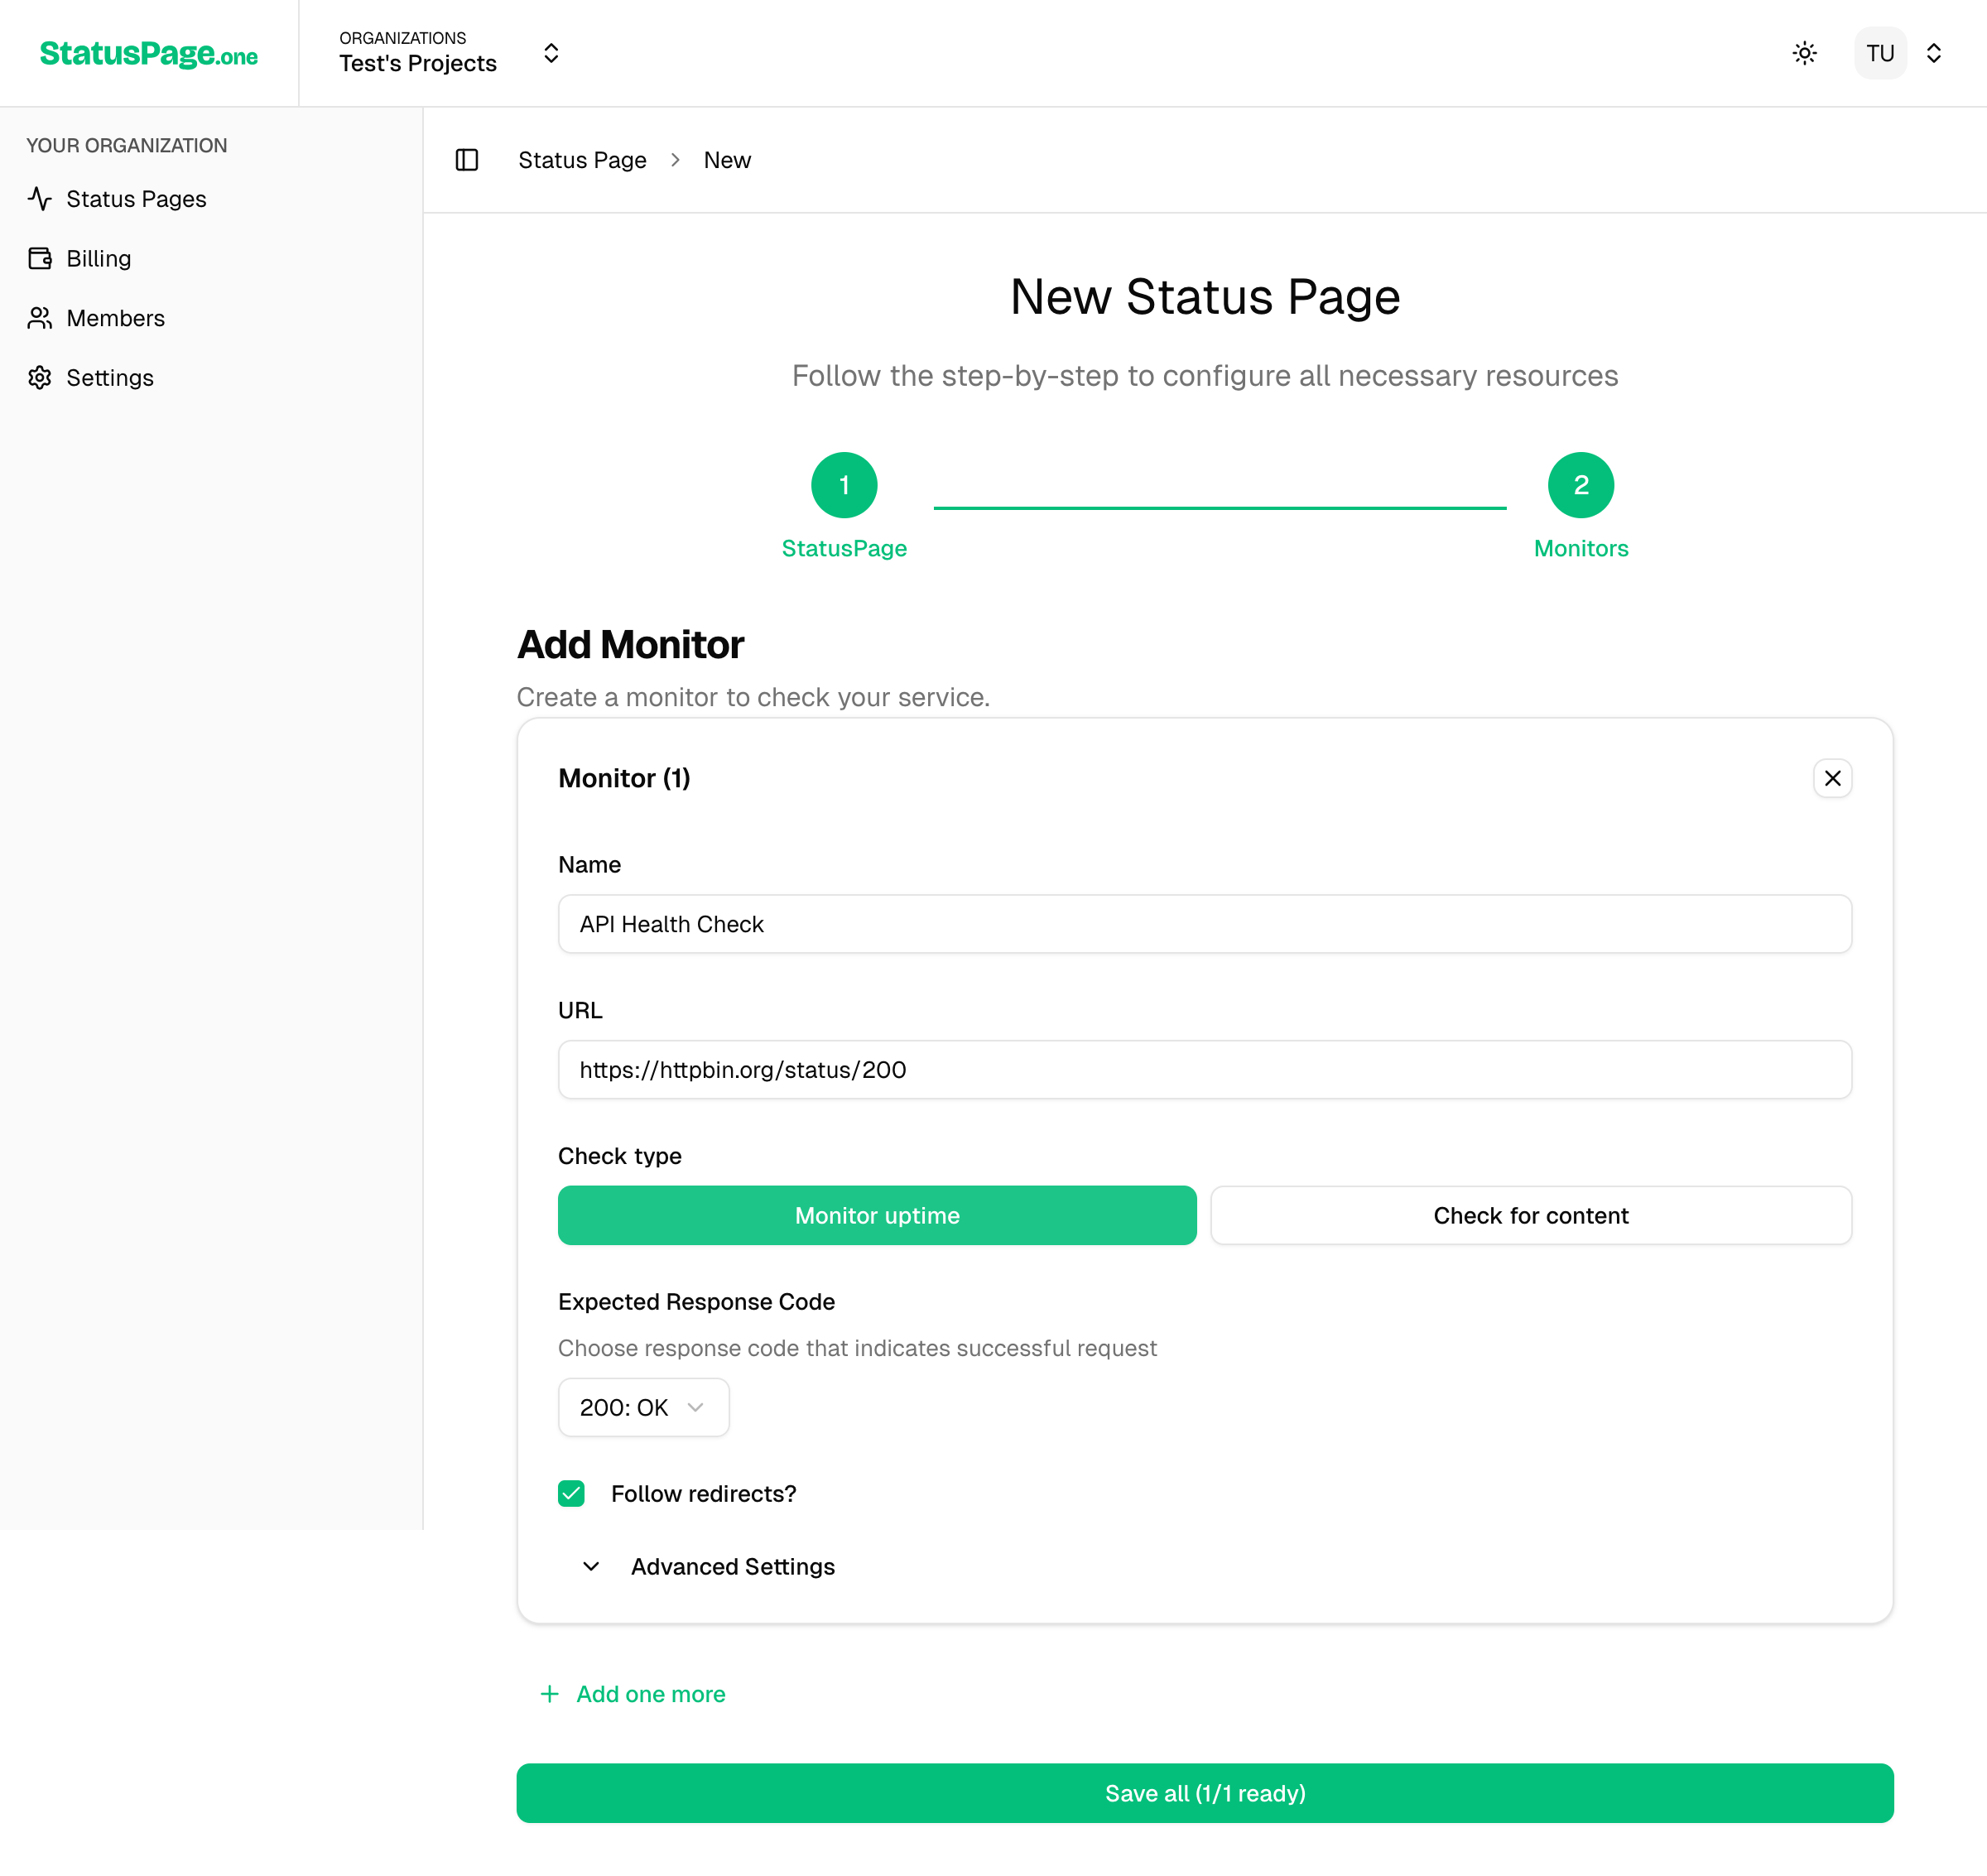
3. Choose Check Type
StatusPageOne offers two types of monitoring:
Checks if your service responds with a successful HTTP status code.
Best for:
- • Website availability
- • API health endpoints
- • Service uptime monitoring
Checks if specific content is present or absent in the response.
Best for:
- • Content delivery verification
- • Error page detection
- • Dynamic content monitoring
4. Configure Monitoring Settings
For Uptime Monitoring
Configure how StatusPageOne validates your service responses:
- Expected Response Code: Specify which HTTP status codes indicate success (e.g., "200", "200-299", "200,201,204")
- Follow Redirects: Enable to follow HTTP redirects (recommended: enabled)
For Content Monitoring
Set up content validation rules:
- Content Alert Type:
- NOT_FOUND: Alert when specified content is missing from the response
- FOUND: Alert when specified content appears in the response
- Content to Check: Enter the text string to search for in the response
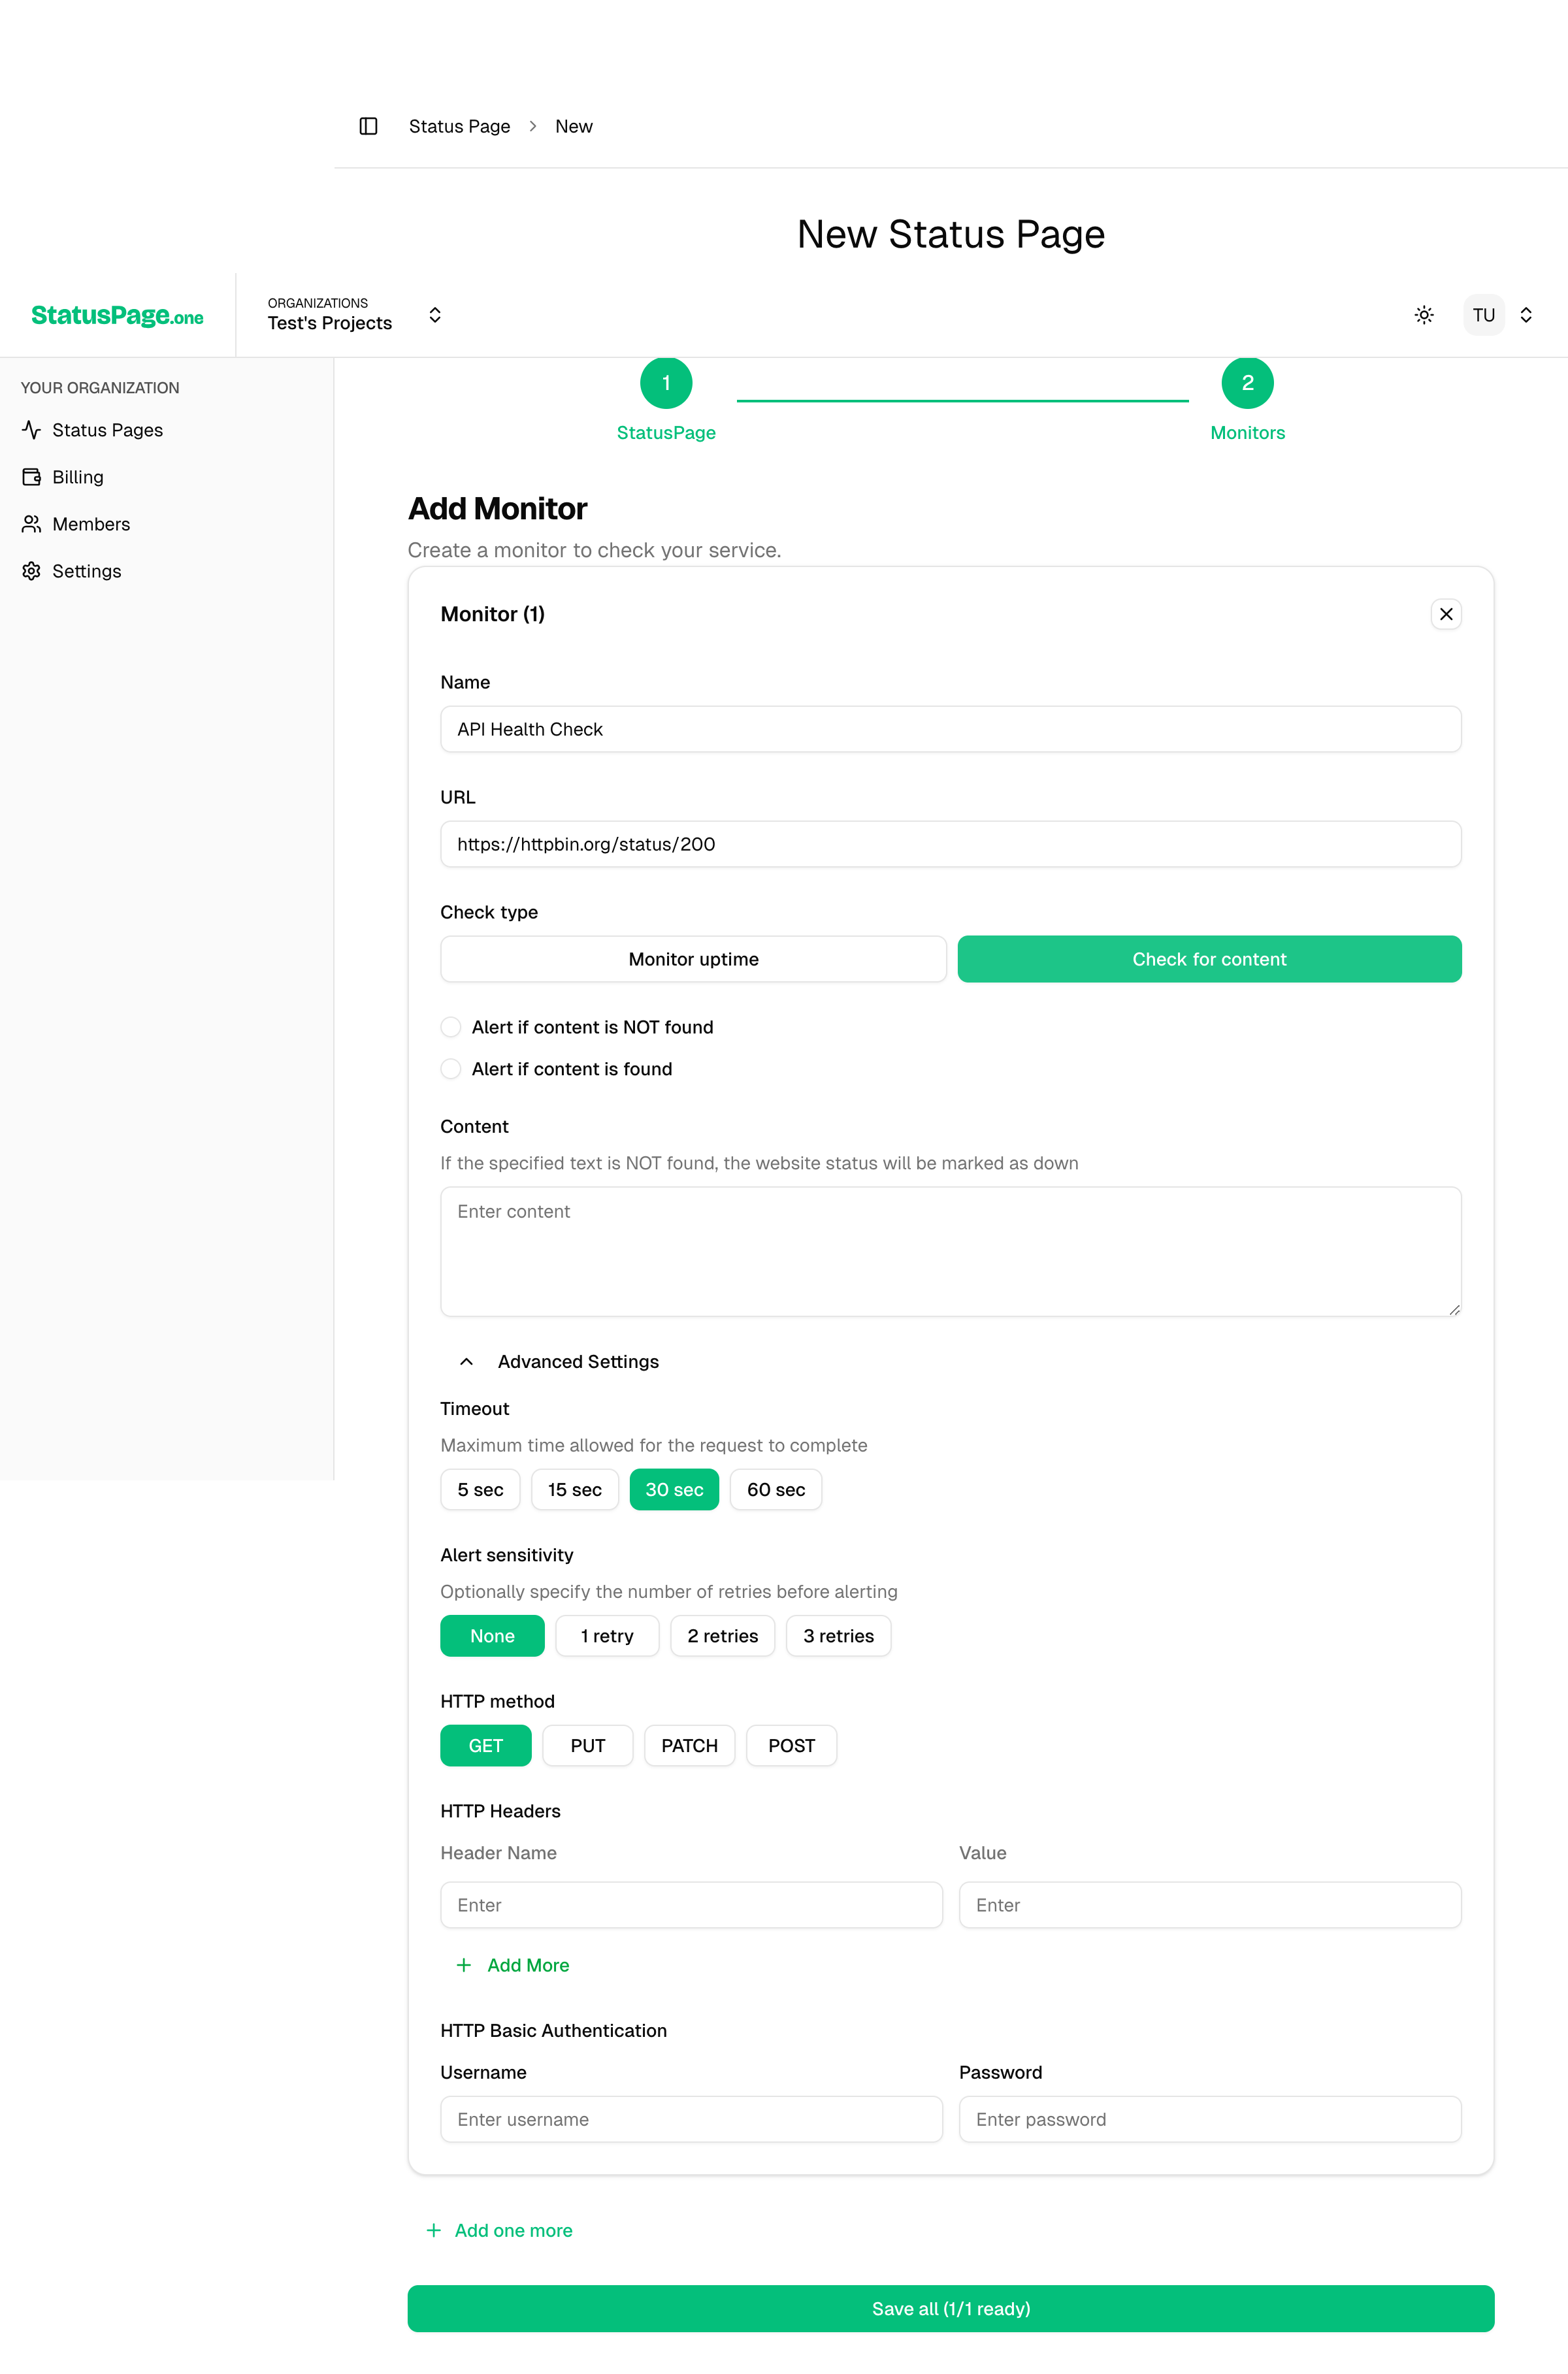
5. Advanced Settings (Optional)
Click Advanced Settings to configure additional options:
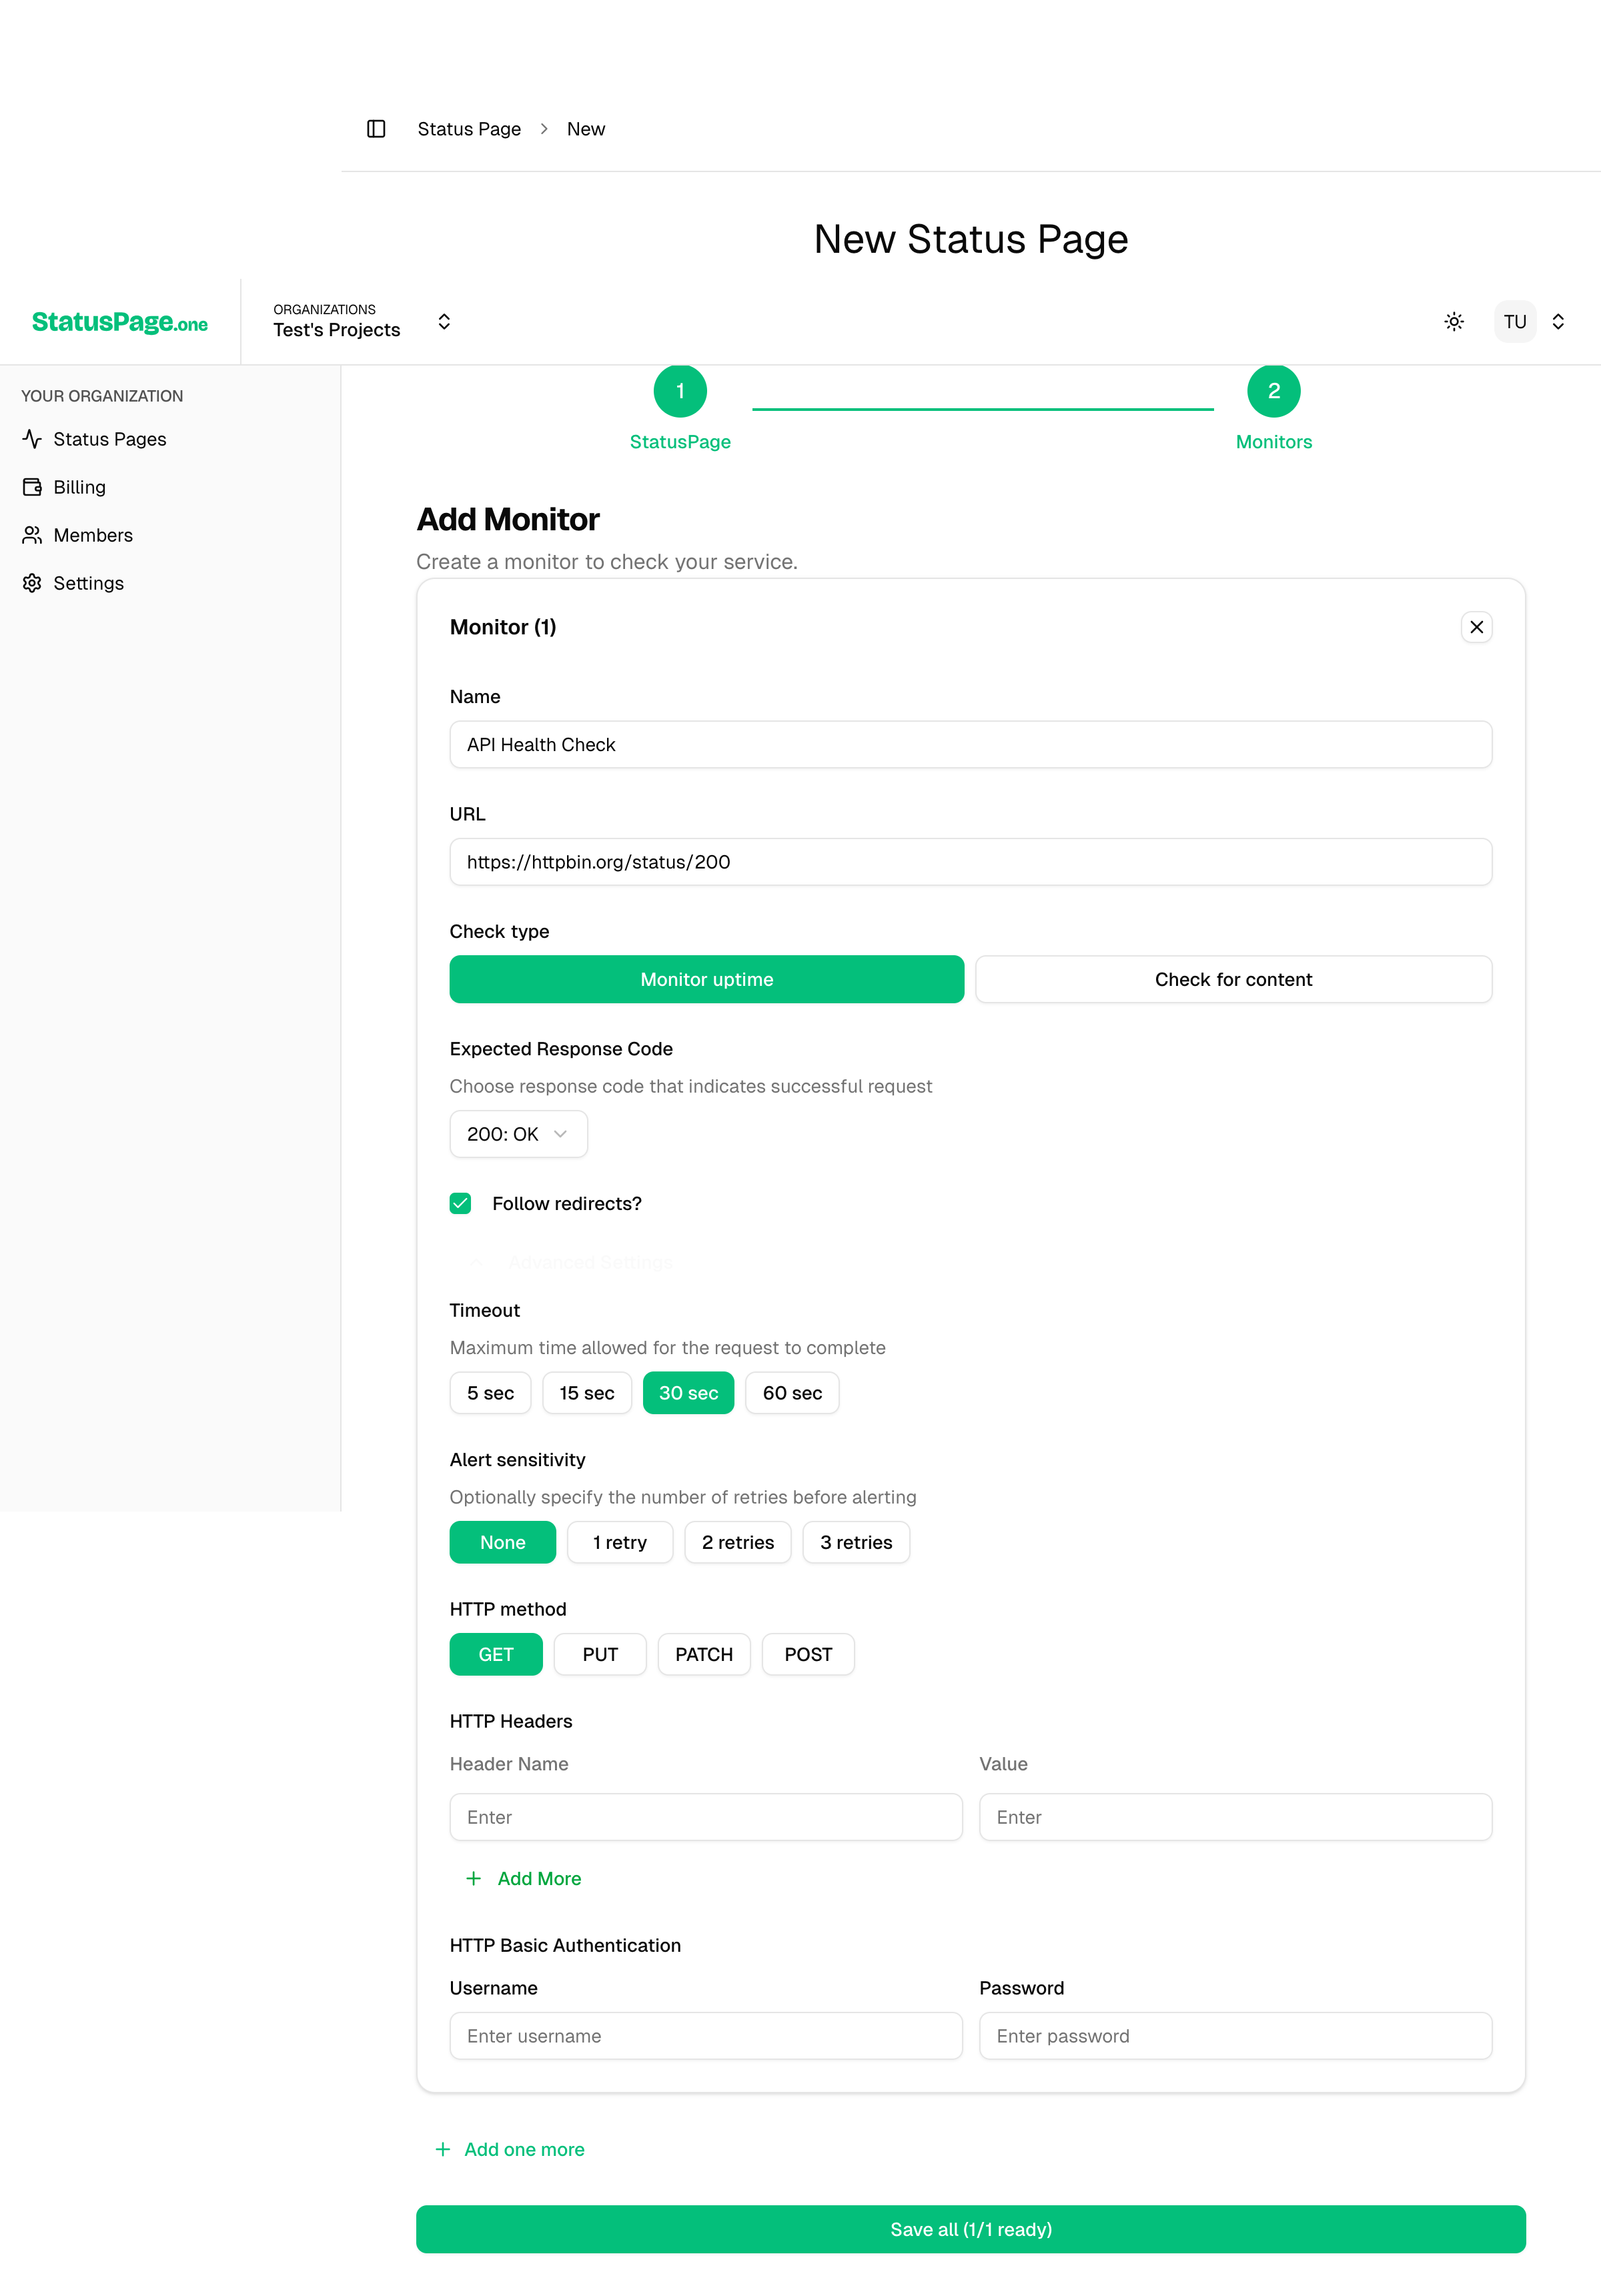
⏱️ Timeout Settings
Maximum time to wait for a response before considering the check failed.
🔄 Alert Sensitivity
Number of retry attempts before sending an alert.
🌐 HTTP Method
Choose the HTTP method for your requests.
6. Authentication & Headers (Optional)
If your endpoint requires authentication or custom headers:
Basic Authentication
- Username: Your basic auth username
- Password: Your basic auth password
Custom Headers
- Click Add Header to add custom HTTP headers
- Common examples:
Authorization,User-Agent,Content-Type
7. Region Selection
Choose which regions should monitor your service:
- 🇺🇸 US East (us-east-1): Default region, good for North American services
- 🇧🇷 South America (sa-east-1): Good for South American services or global validation
Multi-Region Monitoring Tips
- • Select multiple regions to reduce false positives
- • Choose regions closest to your users
- • Consider your service's geographic distribution
- • More regions = more reliable alerting but higher usage
8. Create Your Monitor
- Review all your settings
- Click Save all to create your monitor(s)
- Your monitor will start checking immediately
What Happens Next?
Once your monitor is created:
-
Immediate Checks Begin: Your monitor starts running checks based on your plan's interval (2 minutes for free, 1 minute for paid plans)
-
Data Collection: Response times, uptime percentages, and check results are collected and stored
-
Status Page Updates: Your monitor's status appears on your status page automatically
-
Alert Setup: Proceed to configure alert destinations to receive notifications when issues occur
Multiple Monitors
You can create multiple monitors in one session:
- Click Add one more to create additional monitors
- Each monitor can have different settings and target different services
- All monitors will be created when you click Save all
Next Steps
After creating your monitor:
- Set up Alerting - Configure notifications for downtime events
- Understand Monitor Types - Learn more about uptime vs content monitoring
- Regional Monitoring - Optimize your monitoring regions
Troubleshooting
Common Issues
Monitor shows as DOWN immediately:
- Verify your URL is accessible publicly
- Check if your service requires specific headers or authentication
- Ensure the expected response code matches what your service returns
Authentication not working:
- Verify username and password are correct
- Some services require API keys in headers instead of basic auth
- Check if your endpoint supports the authentication method you're using
Timeouts occurring:
- Increase the timeout value if your service is slow to respond
- Check if your service has rate limiting that might block monitoring requests
- Verify your service is optimized for the regions you're monitoring from
Need help? Check our troubleshooting guide or contact support.
Improve this page
Found an error or want to contribute? Edit this page on GitHub.